Unit 16 - Flooding simulation
Beside DEM (see Unit 15 - Data reprojection) also river streams are required. Such data can be downloaded from OSM database similarly as done in Unit 02 - First steps in the case of Jena city region. See Map Features for details.
Note
Rivers and lakes has been downloaded from OSM using Overpass API.
[bbox:50.85374080,11.50084754,50.98991003,11.67463202];
(
way["waterway"];
);
/*added by auto repair*/
(._;>;);
/*end of auto repair*/
out;
Exported GeoJSON file has been converted to GeoPackage by GDAL ogr2ogr utility:
ogr2ogr -f GPKG -dialect SQLite \
-sql "select * from export where st_geometrytype(geometry) IN ('LINESTRING', 'MULTILINESTRING')" \
-nln jena_rivers jena_rivers.gpkg export.geojson
For simplification pre-processed river streams are included in sample
dataset as osm/jena-rivers.gpkg file.
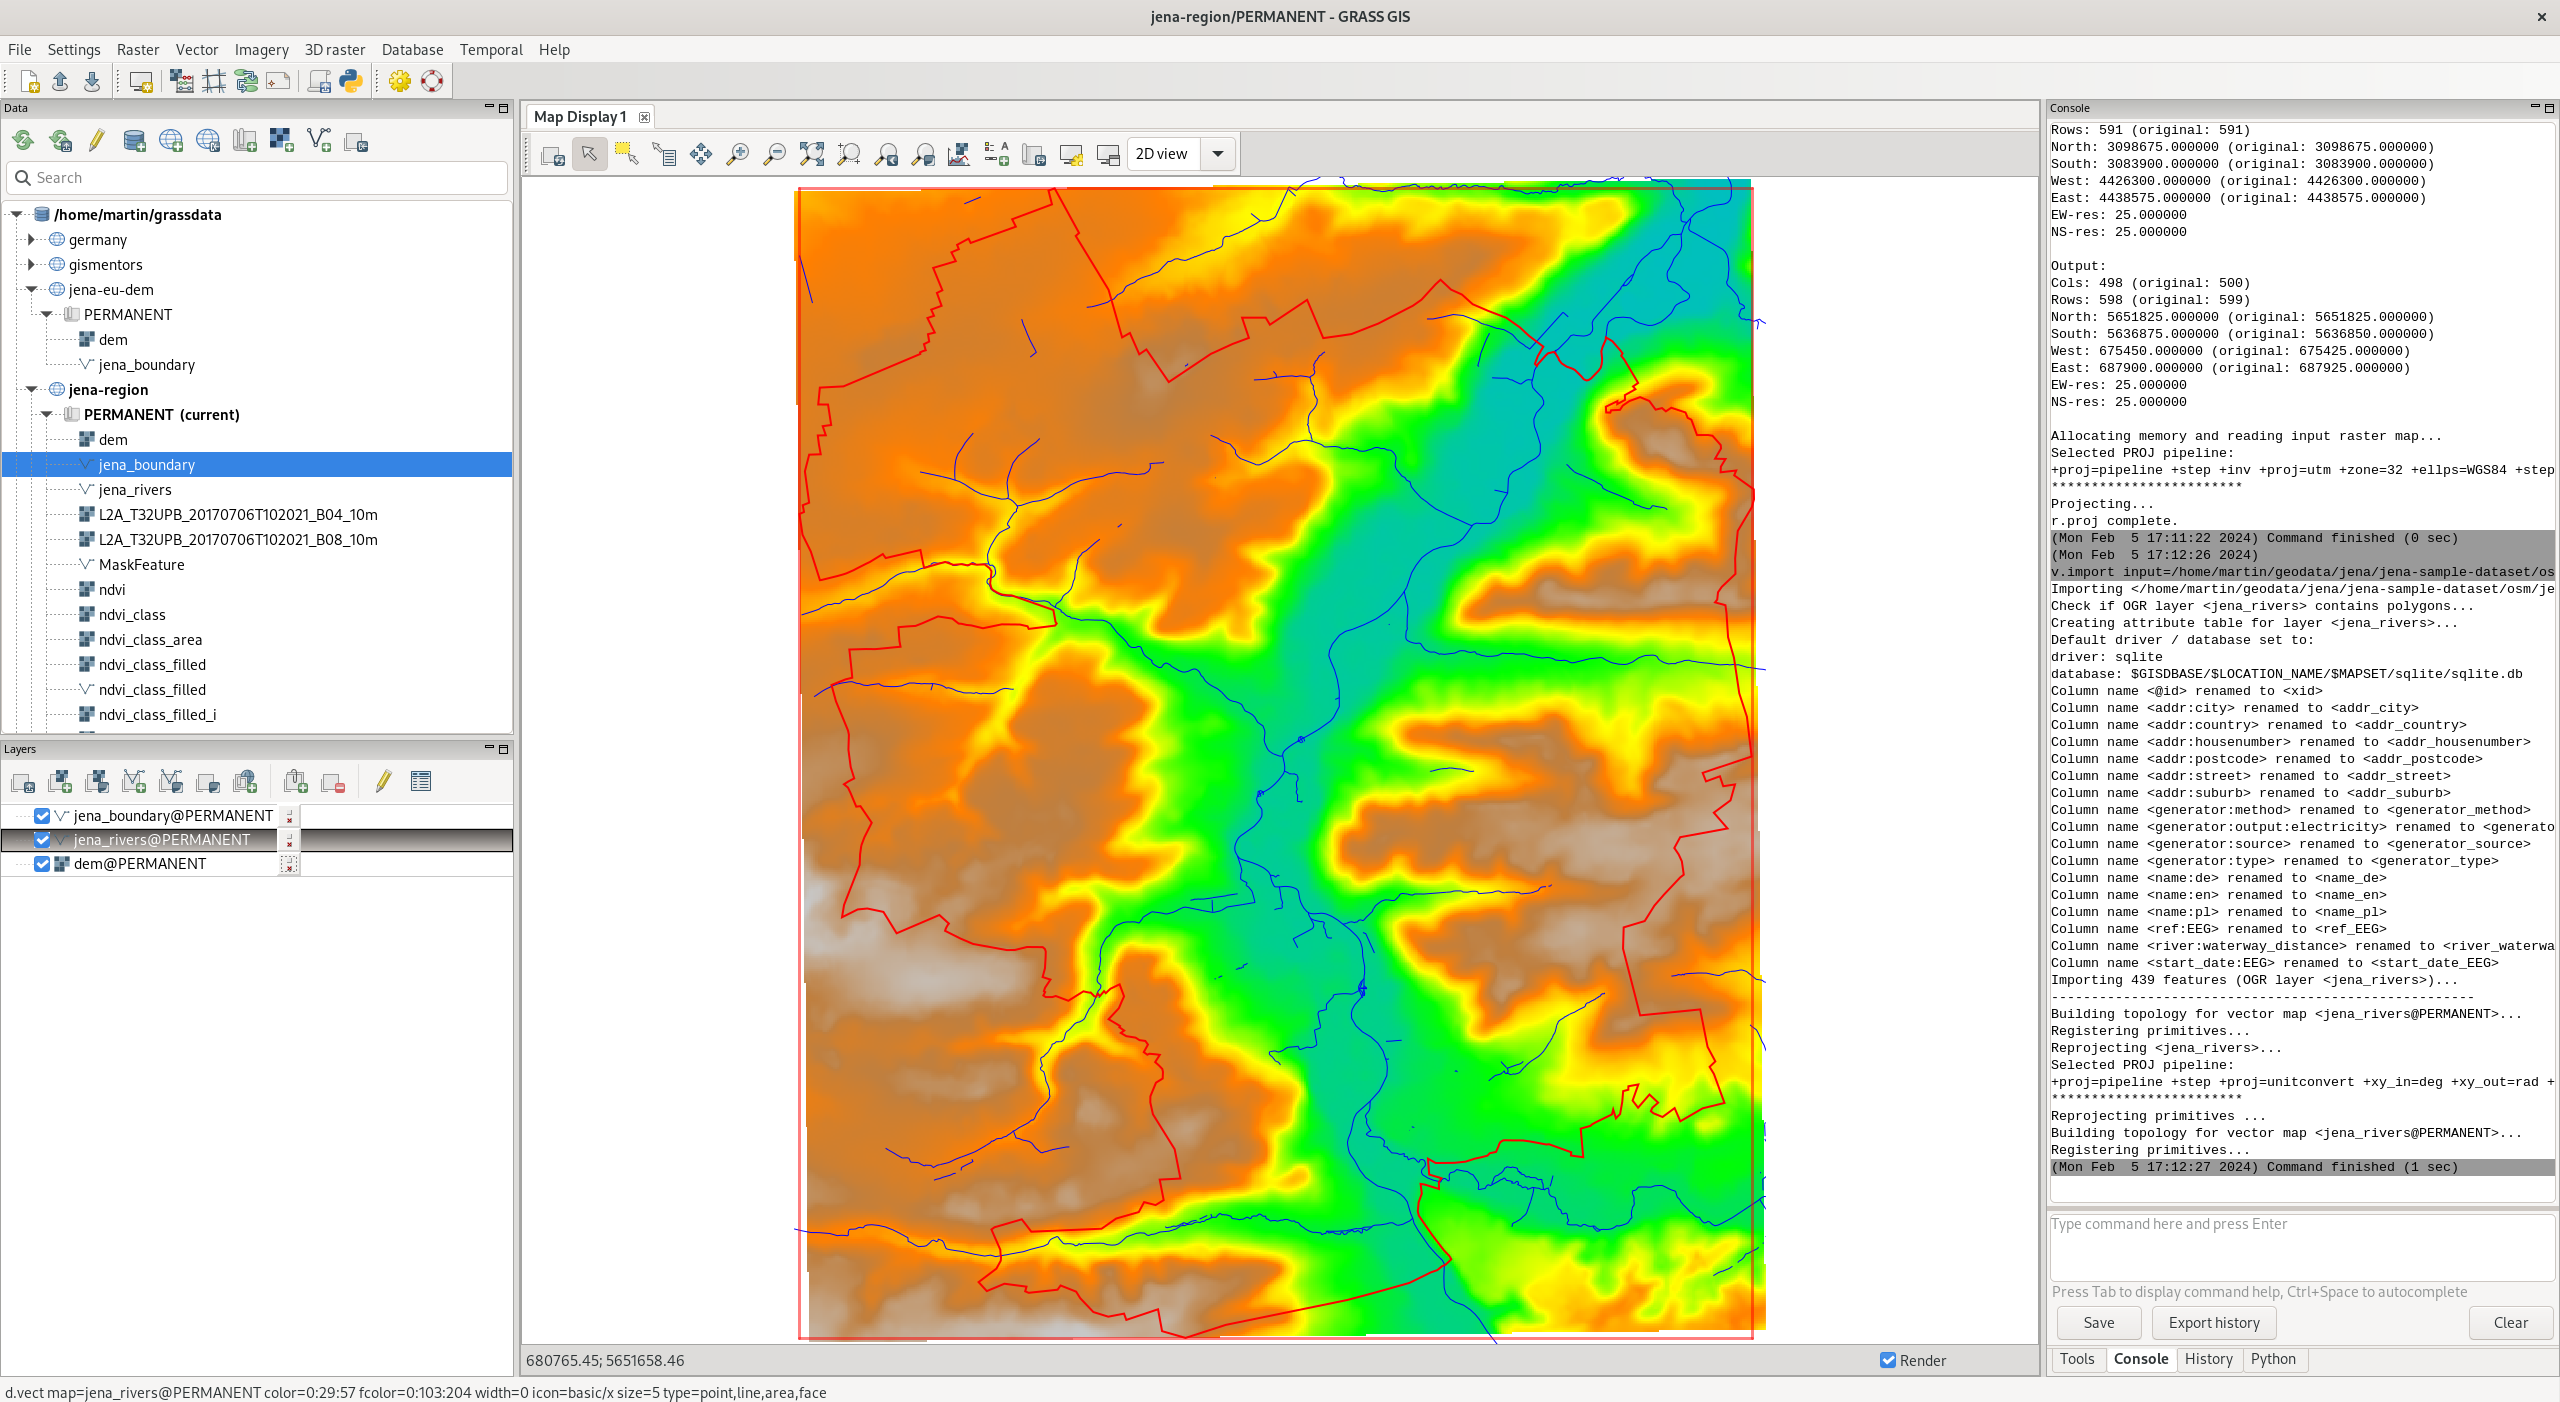
Fig. 89 DEM, Jena boundary and rivers provided by OSM.
Flooding can be easily simulated by r.lake tool which fills a lake to a target water level from a given start point or seed raster. The resulting raster map contains cells with values representing lake depth (NULL for all other cells beyond the lake).
Note
Before running r.lake let’s start organizing our work. Till now we used PERMANENT mapsets only. There is input data like DEM, Jena city region, cloud mask vector map, Sentinel bands, results of NDVI computation and so on. Data organization can be improved by using multiple mapsets. Let’s create a new mapset flooding in the current project jena-region. New mapset from Data tab or by g.mapset tool.
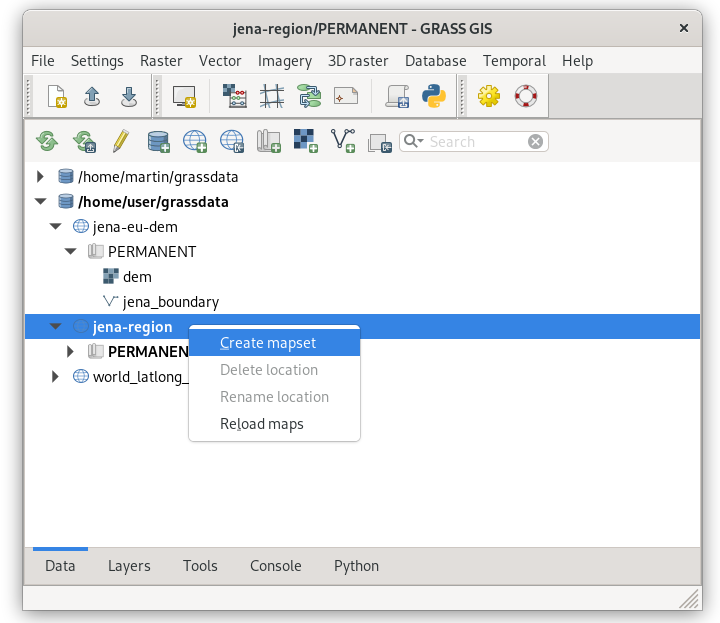
Fig. 90 Create a new mapset in Data tab.
The r.lake requires seeds coordinates and water level to be defined. The coordinates can be set also interactively as Fig. 91 shows.
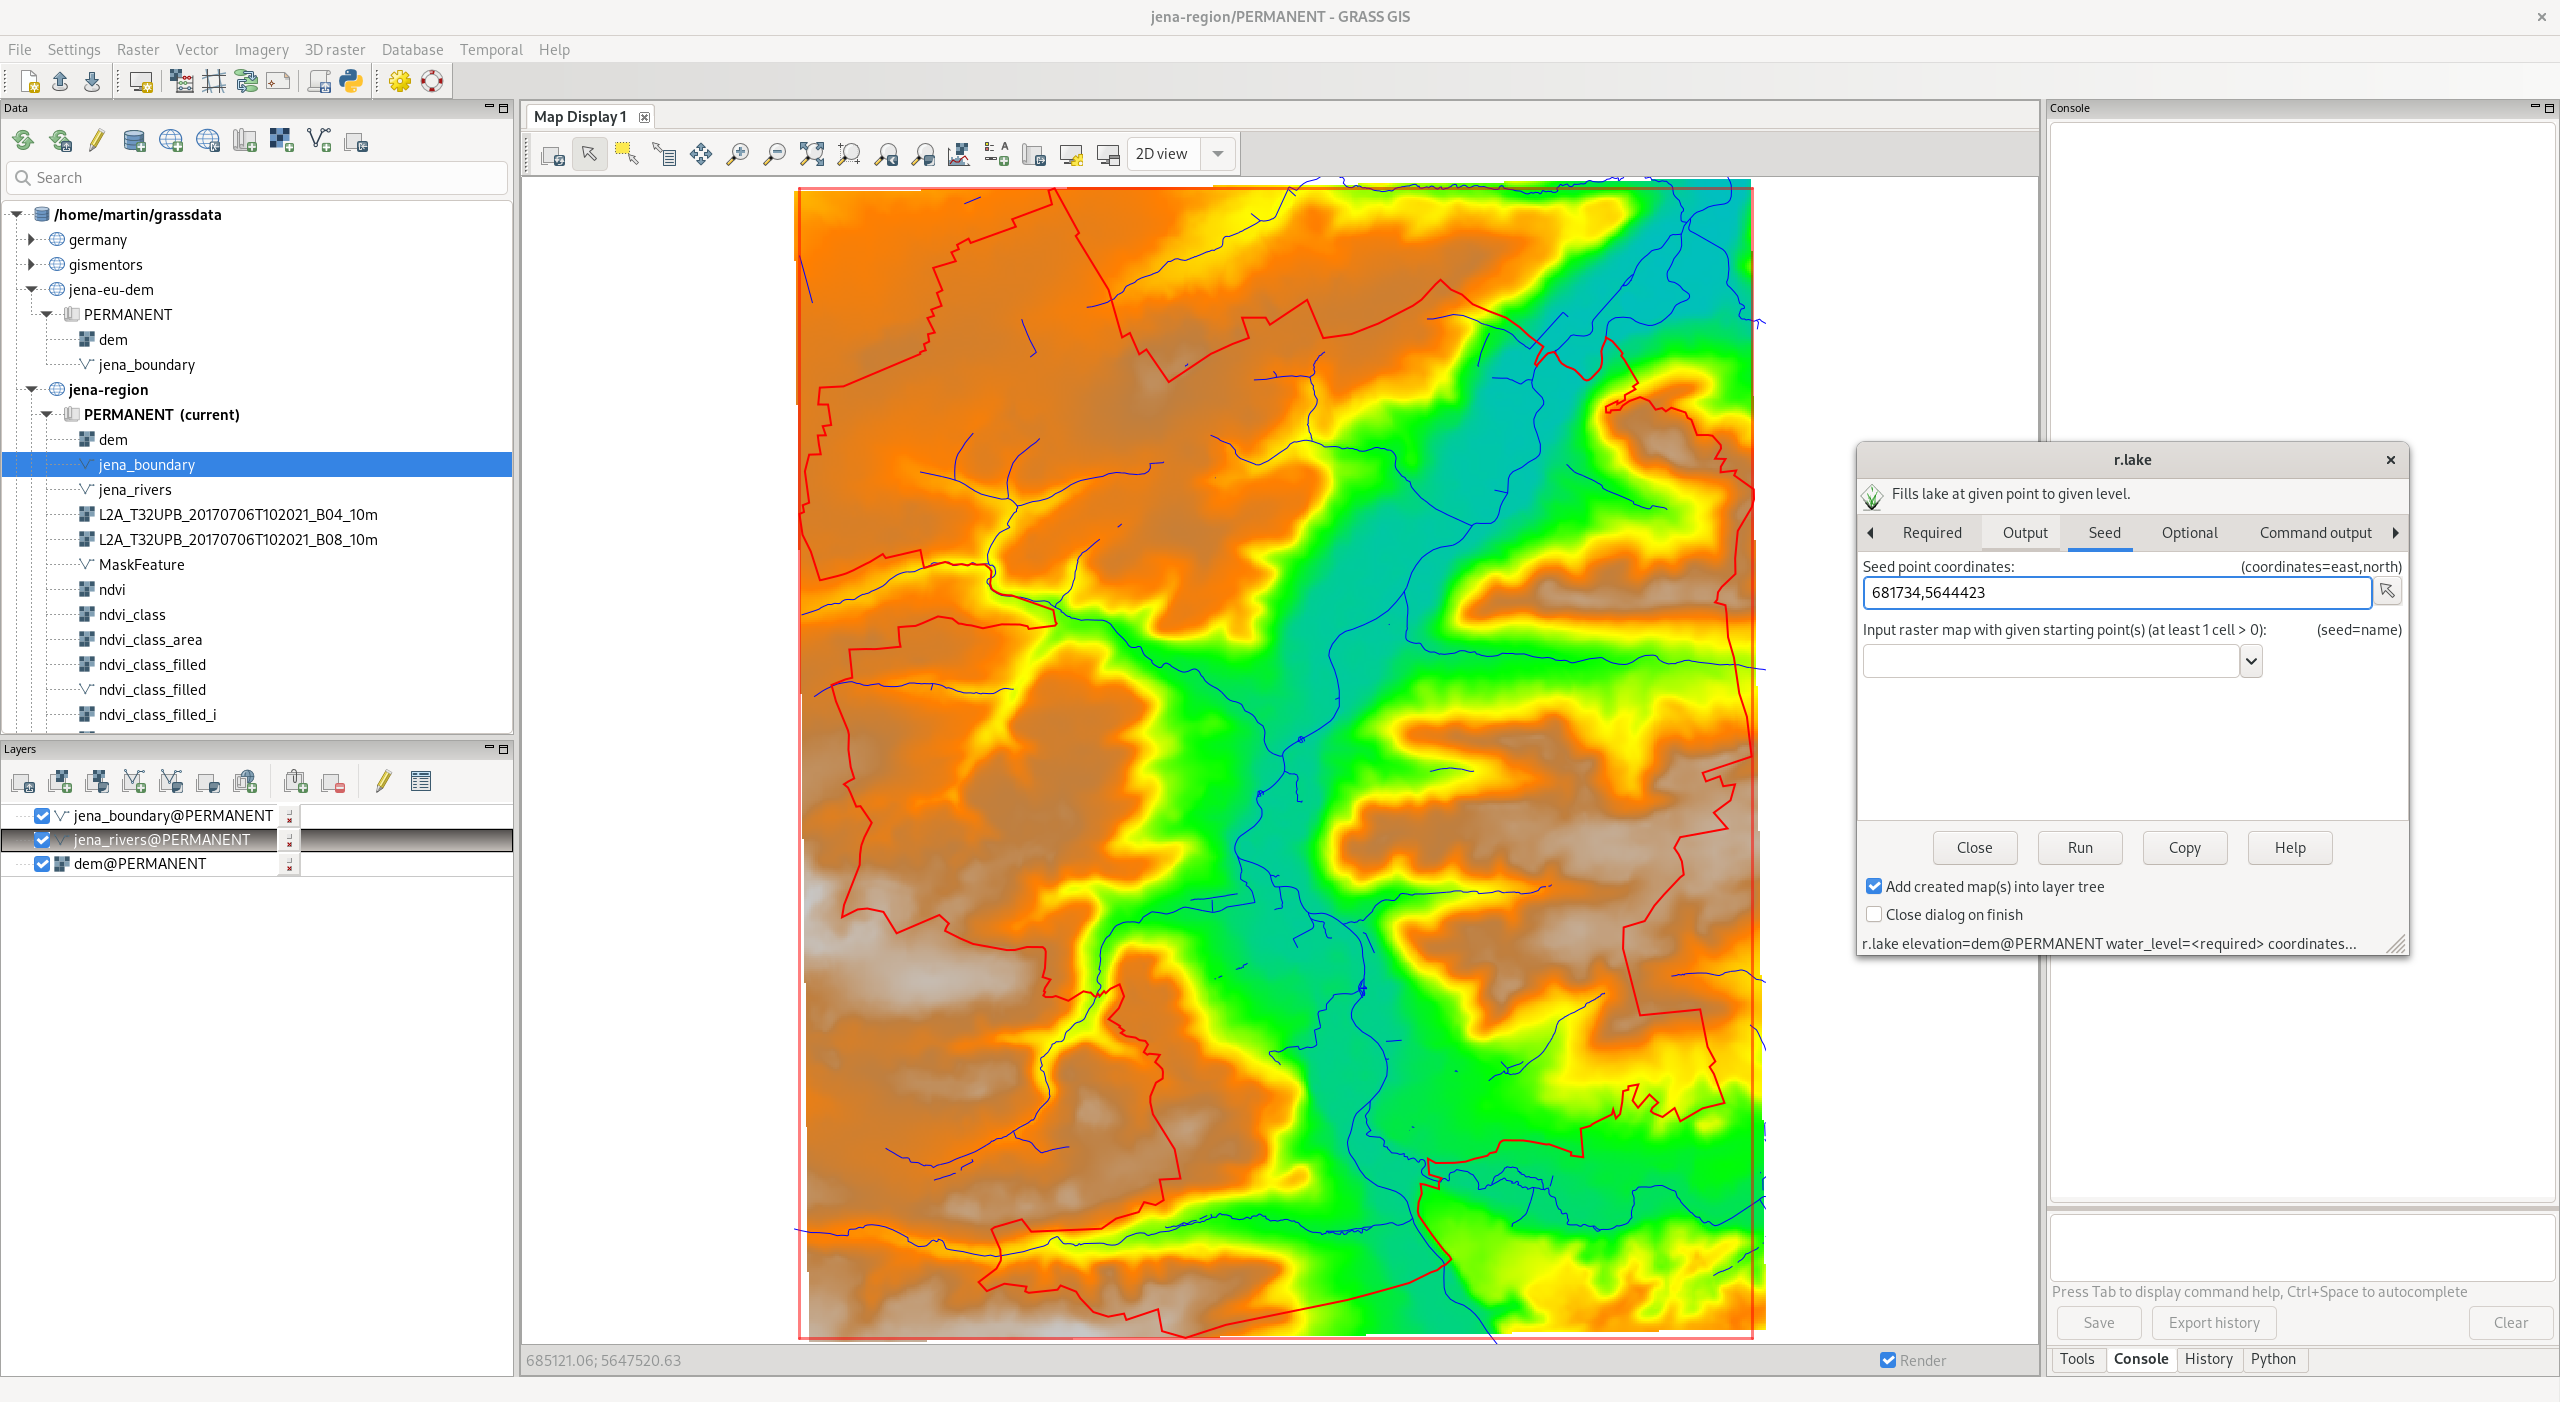
Fig. 91 Set seed coordinates interactively from map display.
Height of seed point can be determined by querying DEM map layer
 Query raster/vector map(s) from Map Display
toolbar (see Fig. 92) or directly using r.what
tool:
Query raster/vector map(s) from Map Display
toolbar (see Fig. 92) or directly using r.what
tool:
r.what map=dem coordinates=681734,5644423
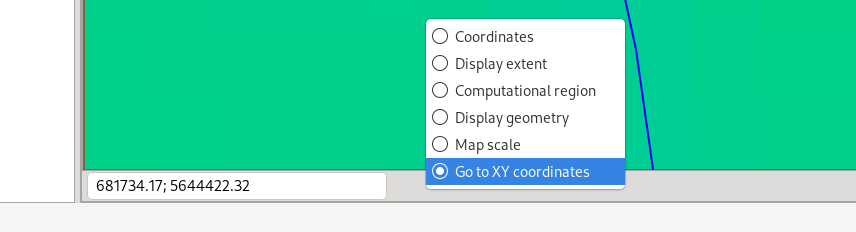
Fig. 92 Select Go to coordinates.
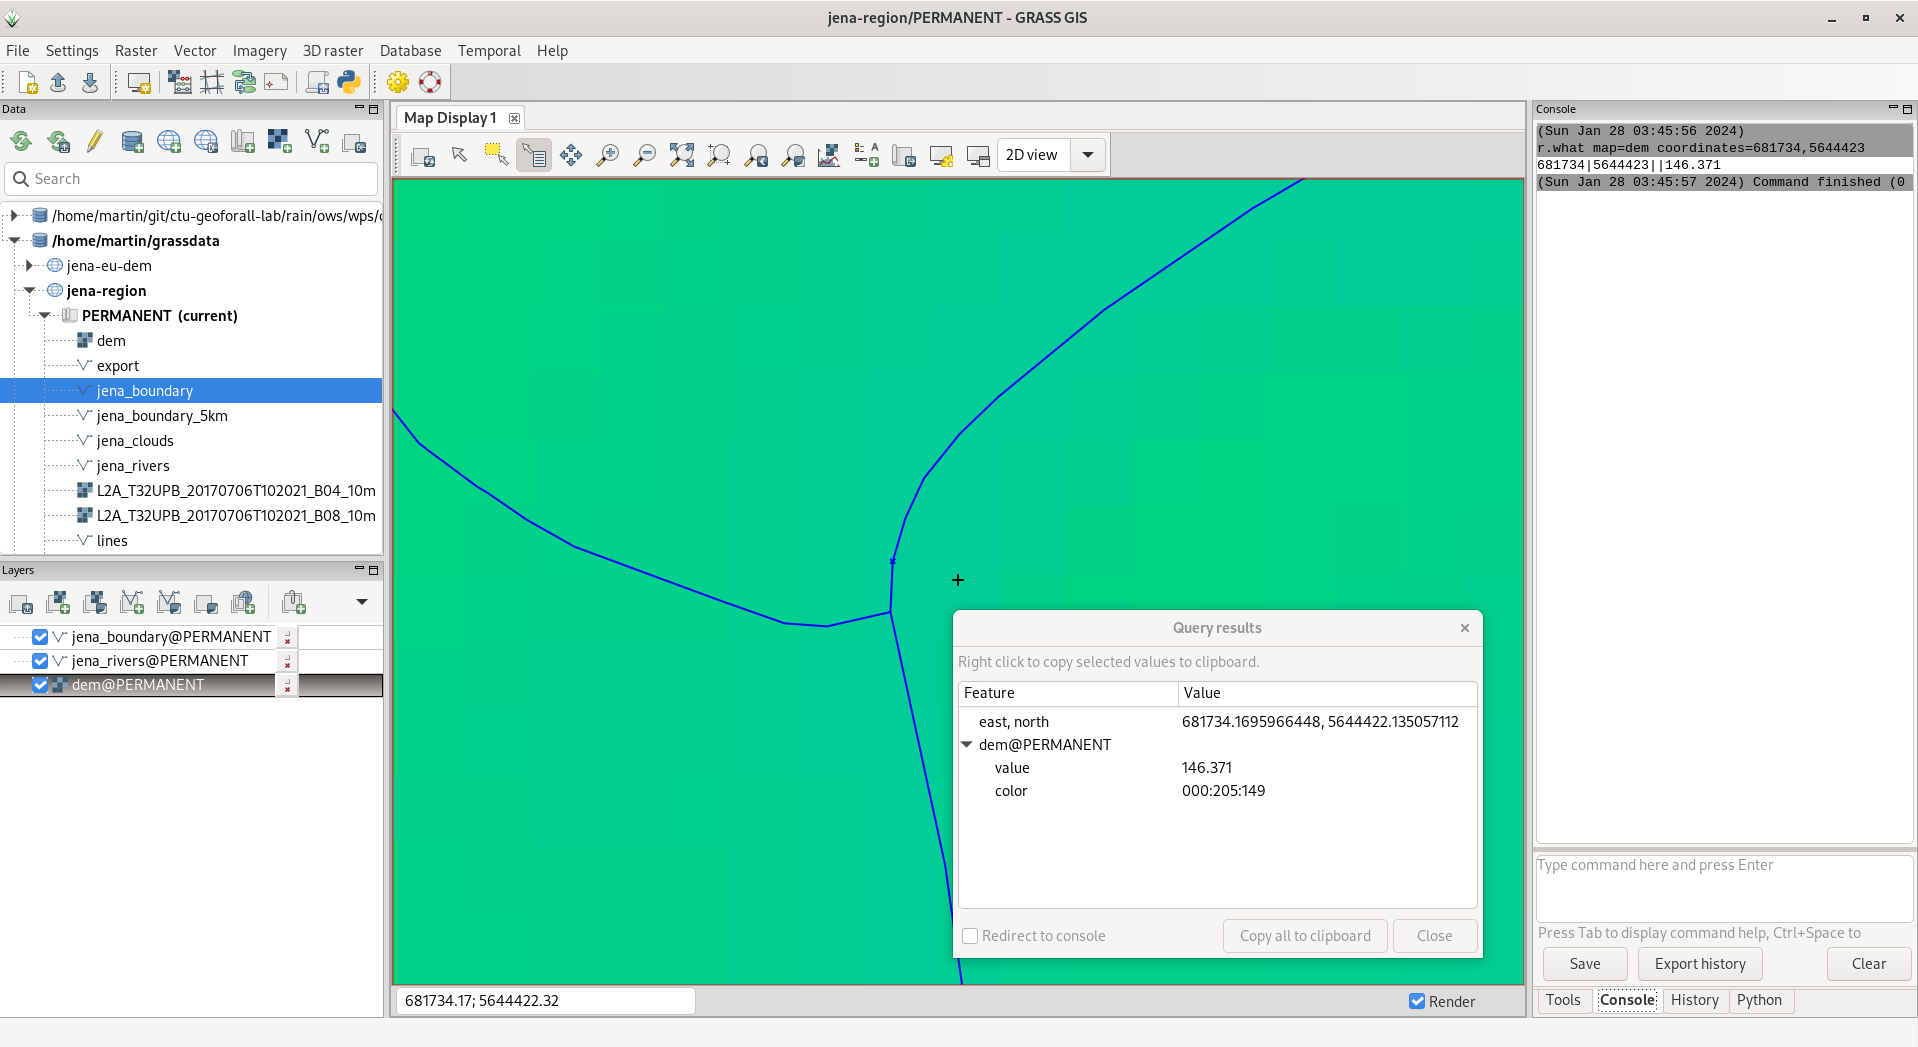
Fig. 93 Query DEM layer for an elevation value.
Before starting computation the computation region have to be set based on dem raster map.
g.region raster=dem
r.lake elevation=dem water_level=146.4 lake=lake coordinates=681734,5644423
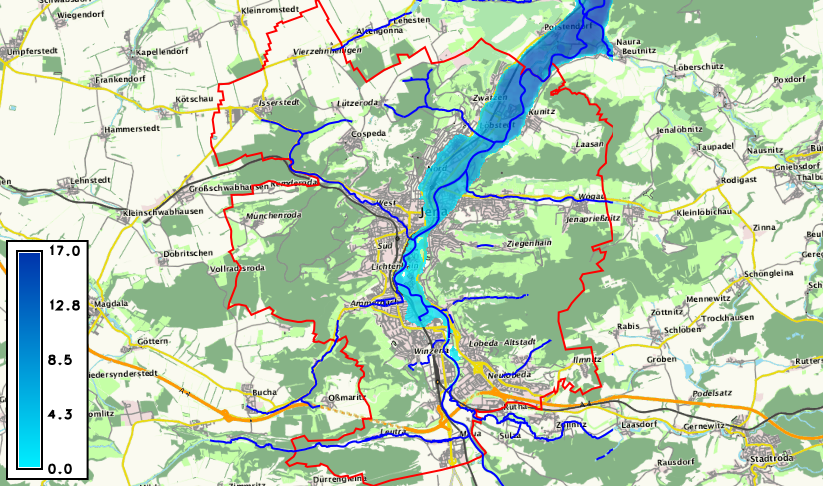
Fig. 94 Flooding simulation on water level 150m, OSM WMS as basemap.
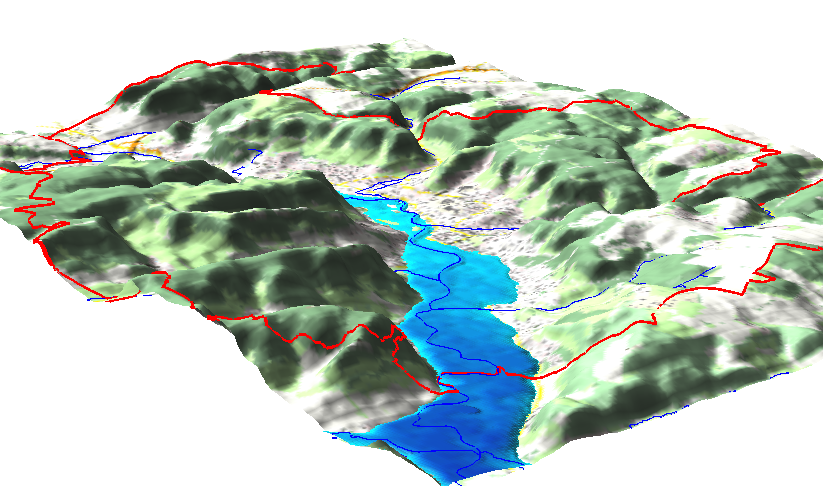
Fig. 95 Flooding similation in 3D view.