Unit 11 - PyGRASS scripting
Let’s start with a Python script created by Graphical Modeler in
Unit 10. Run this script from the main toolbar
by  Launch user-defined script.
Note
Before starting the script GRASS will ask about adding a script directory path into GRASS_ADDON_PATH. It can be useful if you will run script(s) from this directory more often. Then you don’t need to define full path to scripts, script name will be enough.
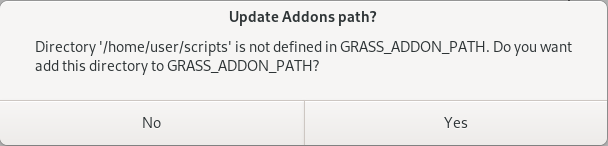
Fig. 70 Add script directory into GRASS Addon Path.
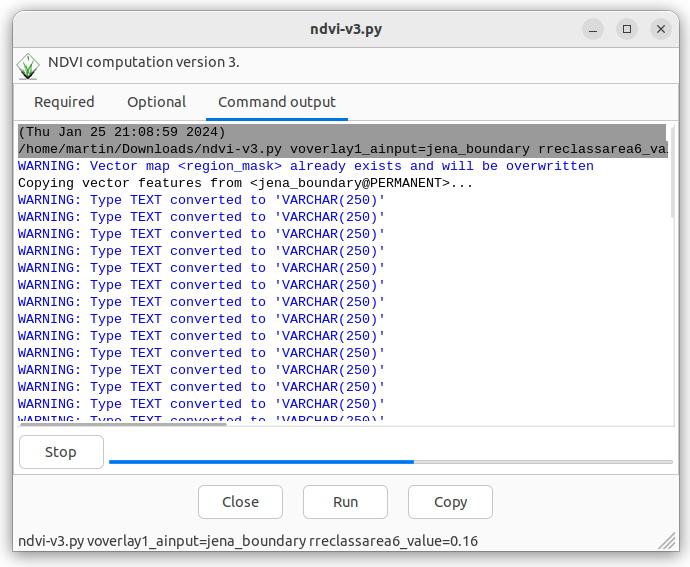
Fig. 71 Script output is printed into Console tab.
Open exported Python script by your favorite IDE or if your do not
have any just use GRASS-integrated Python editor  Open
a simple Python code editor.
Open
a simple Python code editor.
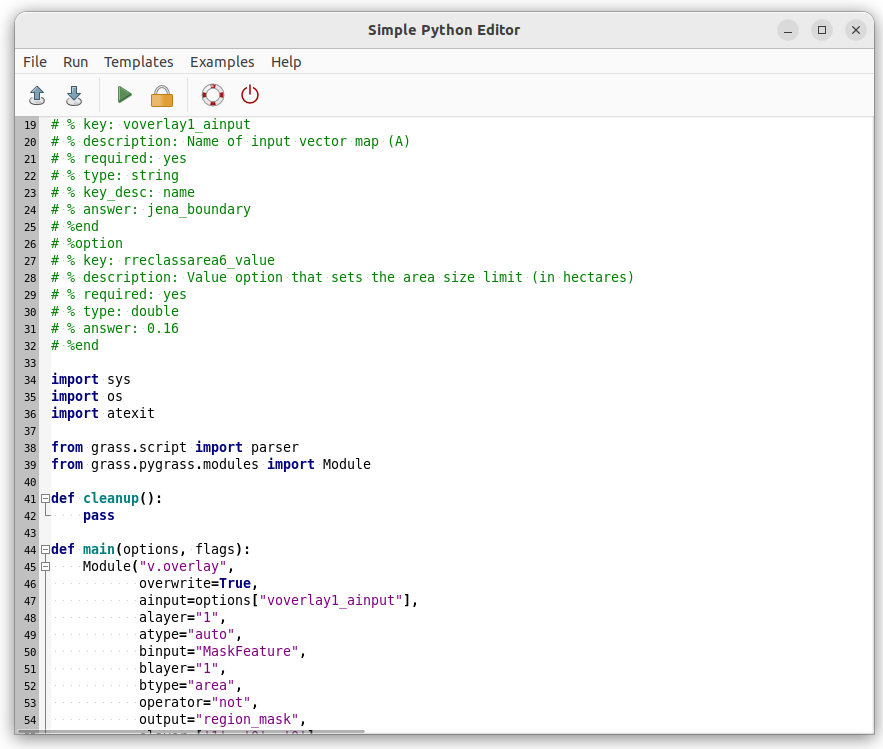
Fig. 72 Simple GRASS Python code editor in action.
Load script by  Open and improve the script by
printing NDVI value statistics (be aware of indentation which is
crucial for Python syntax) as described in Unit 10.
Open and improve the script by
printing NDVI value statistics (be aware of indentation which is
crucial for Python syntax) as described in Unit 10.
    m = Module('r.univar', flags='g', map='ndvi', stdout_=PIPE)
    stats = parse_key_val(m.outputs.stdout, val_type=float)
    print('-' * 80)
    print('NDVI value statistics')
    print('-' * 80)
    print('NDVI min value: {0:.4f}'.format(stats['min']))
    print('NDVI max value: {0:.4f}'.format(stats['max']))
    print('NDVI mean value: {0:.4f}'.format(stats['mean']))
Note
Import also relevant function
from subprocess import PIPE
from grass.script import parser, parse_key_val
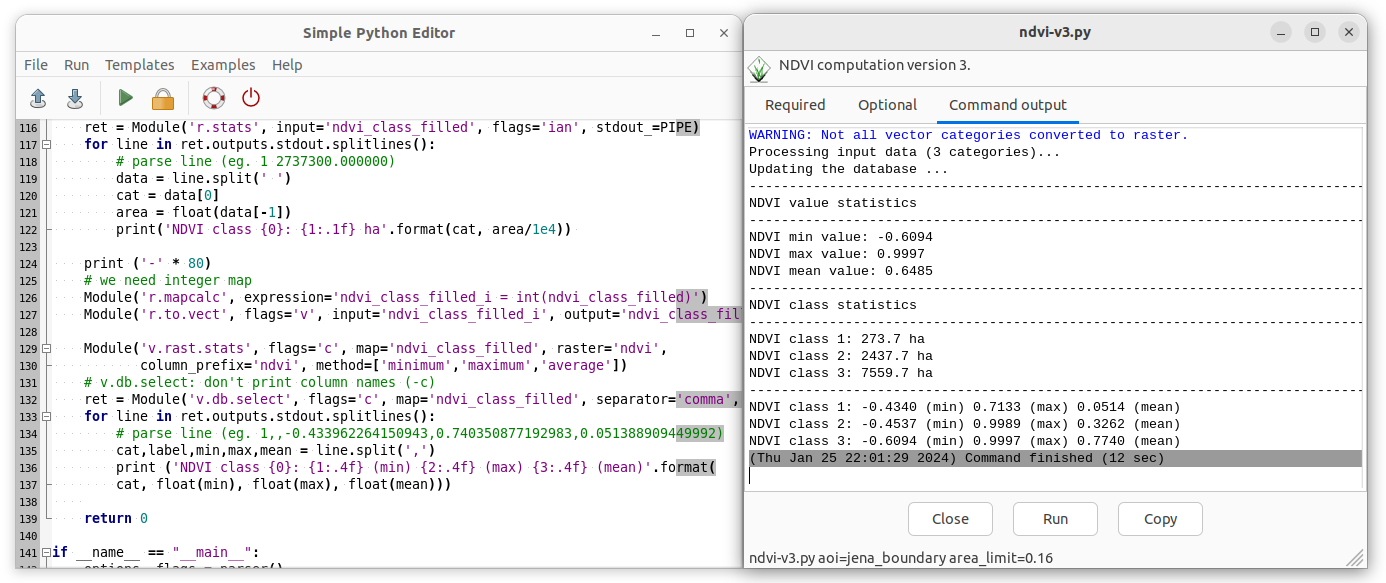
Fig. 73 Launch script by  Run and check out an output
in Console tab.
Run and check out an output
in Console tab.
Statistics
Let’s add additional NDVI classes statistics computed by r.stats:
r.stats -ian input=ndvi_class_filled
In Python:
    print ('-' * 80)
    print ('NDVI class statistics')
    print ('-' * 80)
    ret = Module('r.stats', input='ndvi_class_filled', flags='ian', stdout_=PIPE)
    for line in ret.outputs.stdout.splitlines():
        # parse line (eg. 1 2737300.000000)
        data = line.split(' ')
        cat = data[0]
        area = float(data[-1])
        print('NDVI class {0}: {1:.1f} ha'.format(cat, area/1e4))
Output of r.stats tool need to be parsed. Unfortunately
the command does not offer a shell script output similarly to
r.univar. This may be solved by Python functions like
splitlines() and split().
Additionally let’s compute also zonal statistics (min, max, mean) for each NDVI class. This could be computed by r.stats.zonal for each object-based statistic (min, max, mean). Alternatively raster classes may be converted to vector by r.to.vect and statistics may be computed by v.rast.stats as shown below.
Note
Unfortunately r.grow.distance is producing floating-point (DCELL) raster data by default. So first, let’s convert ndvi_class_filled from floating-point (DCELL) to integer.
r.mapcalc expression="ndvi_class_filled_i = int(ndvi_class_filled)"
r.to.vect -v input=ndvi_class_filled_i output=ndvi_class_filled type=area
v.rast.stats -c map=ndvi_class_filled raster=ndvi column_prefix=ndvi method=minimum,maximum,average
In Python:
    print ('-' * 80)
    # we need integer map
    Module('r.mapcalc', expression='ndvi_class_filled_i = int(ndvi_class_filled)')
    Module('r.to.vect', flags='v', input='ndvi_class_filled_i', output='ndvi_class_filled', type='area')

    Module('v.rast.stats', flags='c', map='ndvi_class_filled', raster='ndvi',
           column_prefix='ndvi', method=['minimum','maximum','average'])
    # v.db.select: don't print column names (-c)
    ret = Module('v.db.select', flags='c', map='ndvi_class_filled', separator='comma', stdout_=PIPE)
    for line in ret.outputs.stdout.splitlines():
        # parse line (eg. 1,,-0.433962264150943,0.740350877192983,0.051388909449992)
        cat,label,min,max,mean = line.split(',')
        print ('NDVI class {0}: {1:.4f} (min) {2:.4f} (max) {3:.4f} (mean)'.format(
        cat, float(min), float(max), float(mean)))
Example of script output below.
--------------------------------------------------------------------------------
NDVI value statistics
--------------------------------------------------------------------------------
NDVI min value: -0.6094
NDVI max value: 0.9997
NDVI mean value: 0.6485
--------------------------------------------------------------------------------
NDVI class statistics
--------------------------------------------------------------------------------
NDVI class 1: 273.7 ha
NDVI class 2: 2437.7 ha
NDVI class 3: 7559.7 ha
--------------------------------------------------------------------------------
NDVI class 1: -0.4340 (min) 0.7133 (max) 0.0514 (mean)
NDVI class 2: -0.4537 (min) 0.9989 (max) 0.3262 (mean)
NDVI class 3: -0.6094 (min) 0.9997 (max) 0.7740 (mean)
Sample script to download: ndvi-v3.py
Task
In order to simplify testing and improve code readability
split code into two Python functions: compute() and stats().
def main(options, flags):
    compute(options)
    stats(options)

    return 0
Task
Solve issue with statistics which do not follow class definition: eg. minimum value of class 3 (-0.6) is out of range (0.6 to 1.0). This is caused by removing small areas and filling holes by adjacent class.