Unit 07 - QGIS loves GRASS
Let’s step out of the GRASS environment for a moment. QGIS is a very popular open source GIS package which made a significant progress in the last years. Nowadays it’s used in education, academic environment, but also in commercial settings. In 2002 QGIS started a multiplatform viewer for geospatial data. In the recent years QGIS made important steps for being analytical tool. Beside native algoritms QGIS offers also connection to third-party software packages as SAGA, Orfeo or GRASS. GRASS tools can be run directly from QGIS enviroment without starting GRASS explicitly.
Data produced by GRASS may be easily accessed directly from Browser tab.
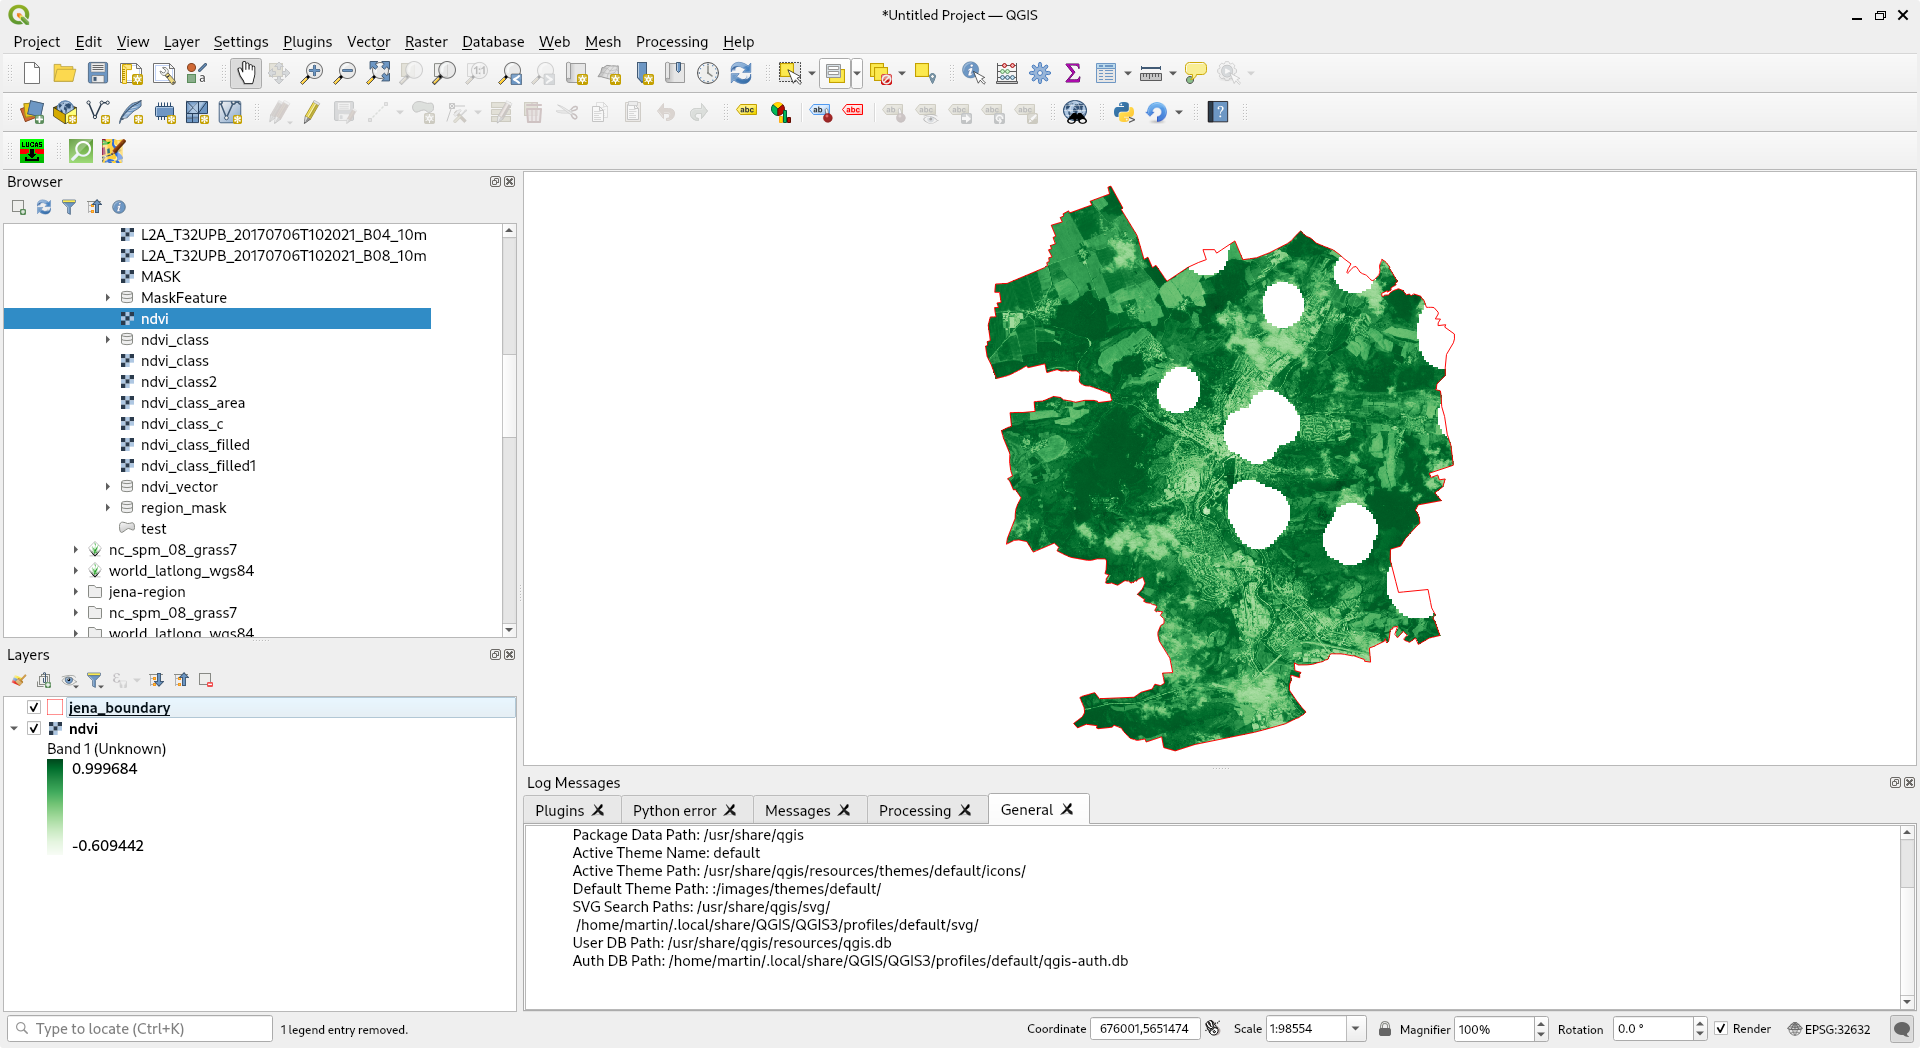
Fig. 42 Show data produced by GRASS in QGIS environment.
Note
QGIS has some issues with GRASS raster data symbology. Broken symbology may be fixed in Properties dialog.
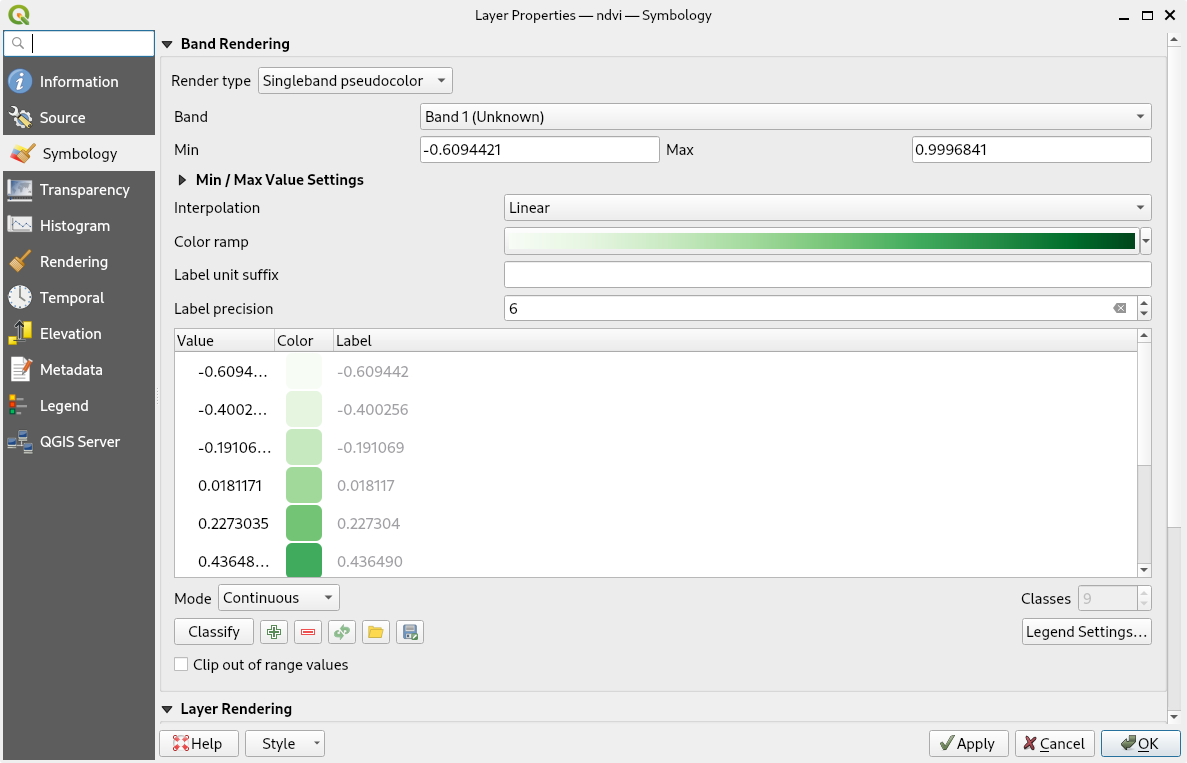
Fig. 43 Set raster symbology in QGIS.
It is also possible to run GRASS tools from Processing plugin.
Let’s compute NDVI as described in Unit 05 - Raster processing using i.vi
GRASS tool, but in this case directly from QGIS UI. Load into QGIS
input data: Jena city region (osm/jena_boundary.gpkg)
and Sentinel bands (red and near-infrared channels) from
sentinel/sample directory.
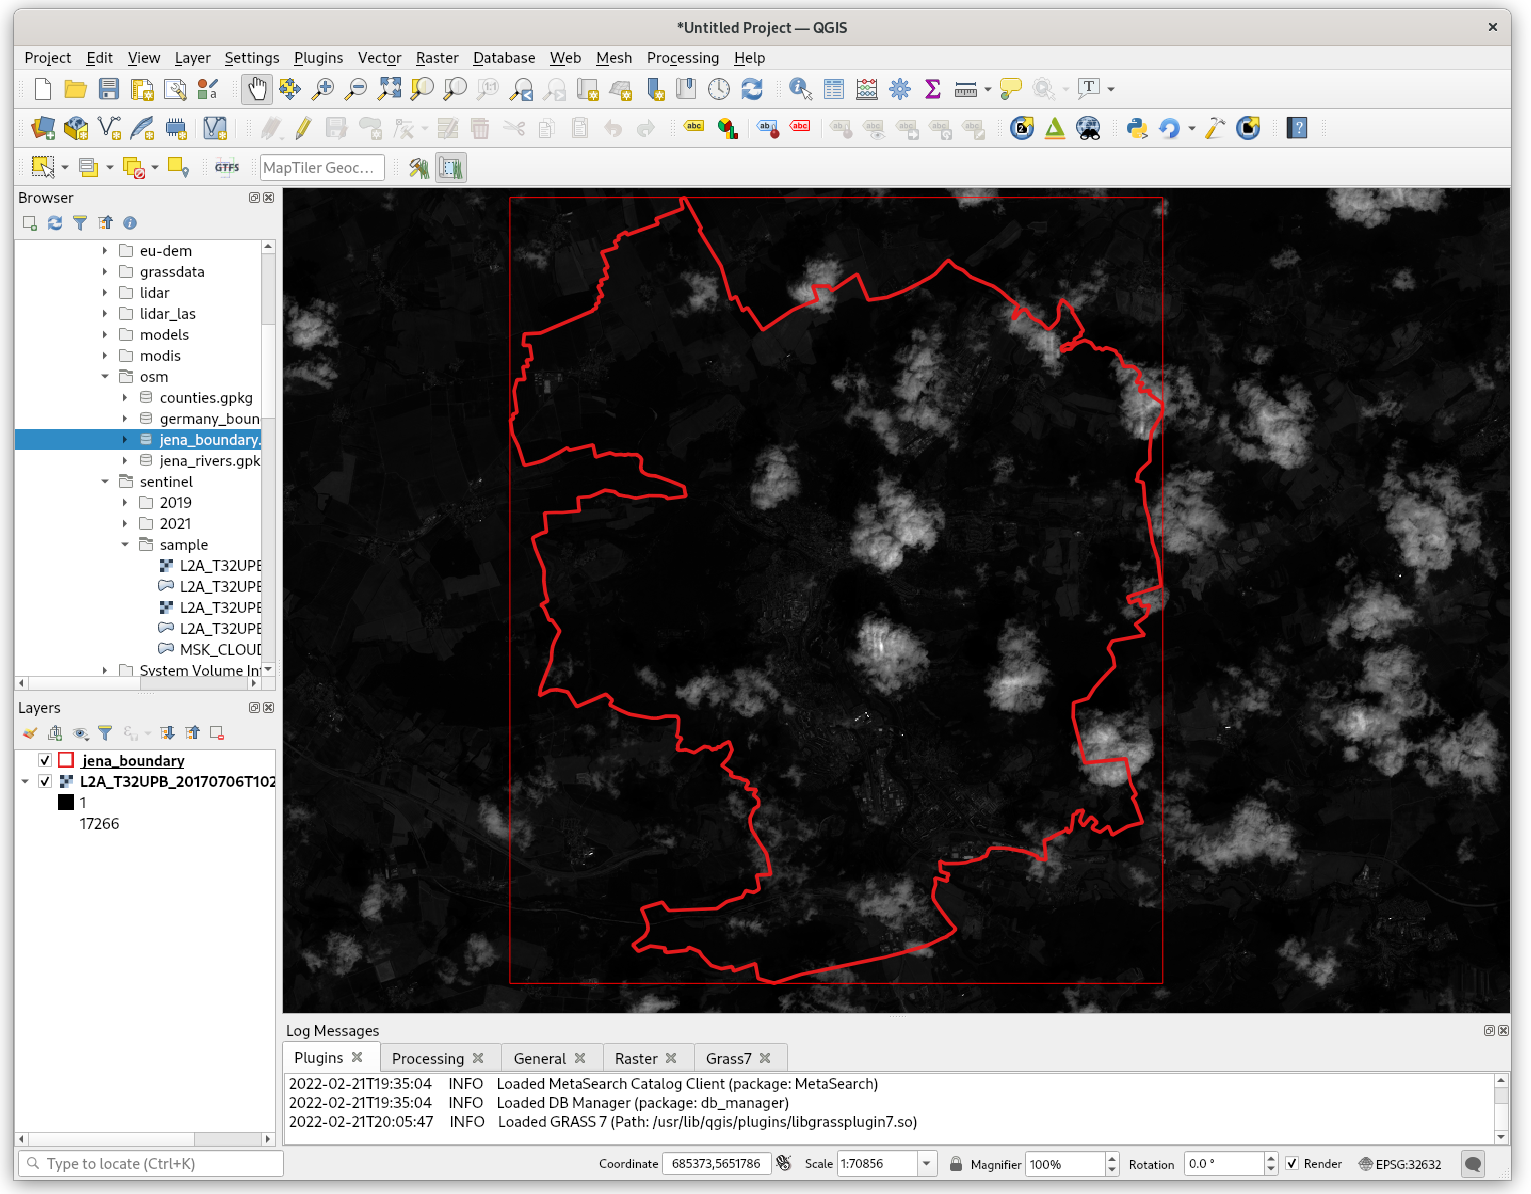
Fig. 44 Input data loaded in QGIS.
Processing plugin
Processing plugin is a generic toolbox which allows to run tools provided by QGIS or third-party software packages like eg. GRASS. Let’s open and search for i.vi GRASS tool.
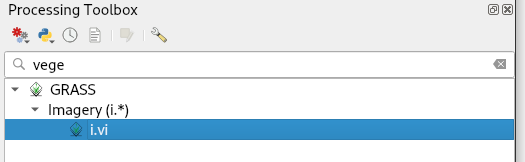
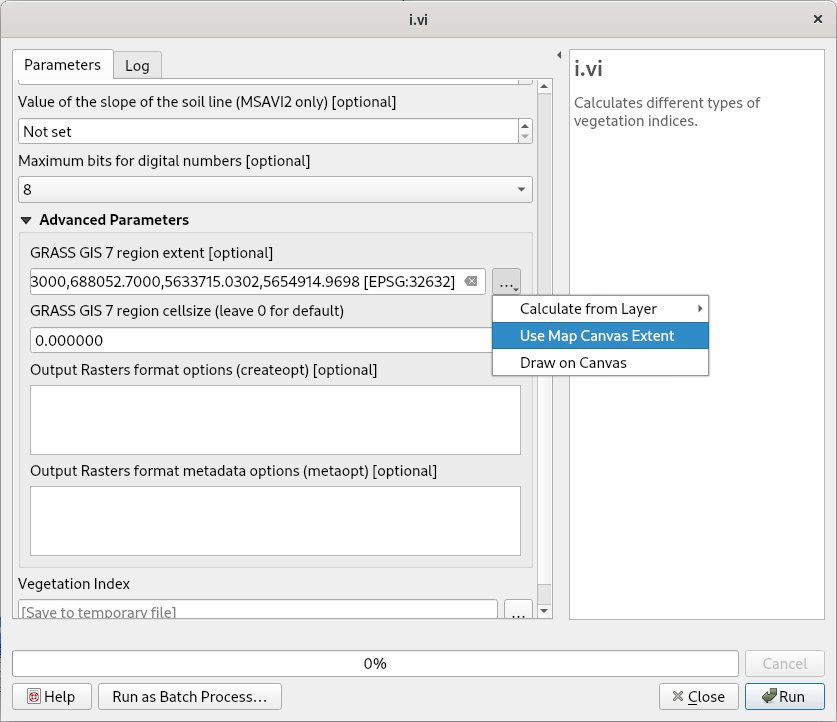
Fig. 46 Set input parameters (red and nir channels). Computation extent can be optionally defined in Advanced parameters section.
Fig. 47 shows how Processing plugin works. First of all a temporary GRASS project is created by g.proj, input data is linked into temporary project by r.external. Then computation can finally starts by running i.vi tool. In the last step output data is exported out of GRASS using r.out.gdal. The resultant GeoTiff file is vizualized in QGIS map window.
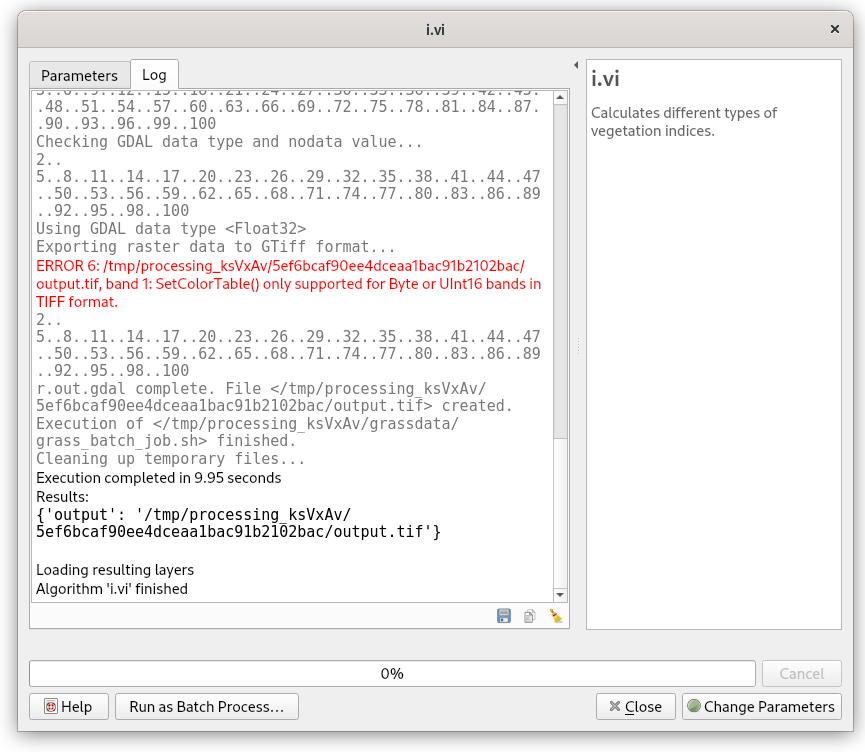
Fig. 47 Running i.vi tool and exporting result from GRASS temporary project.
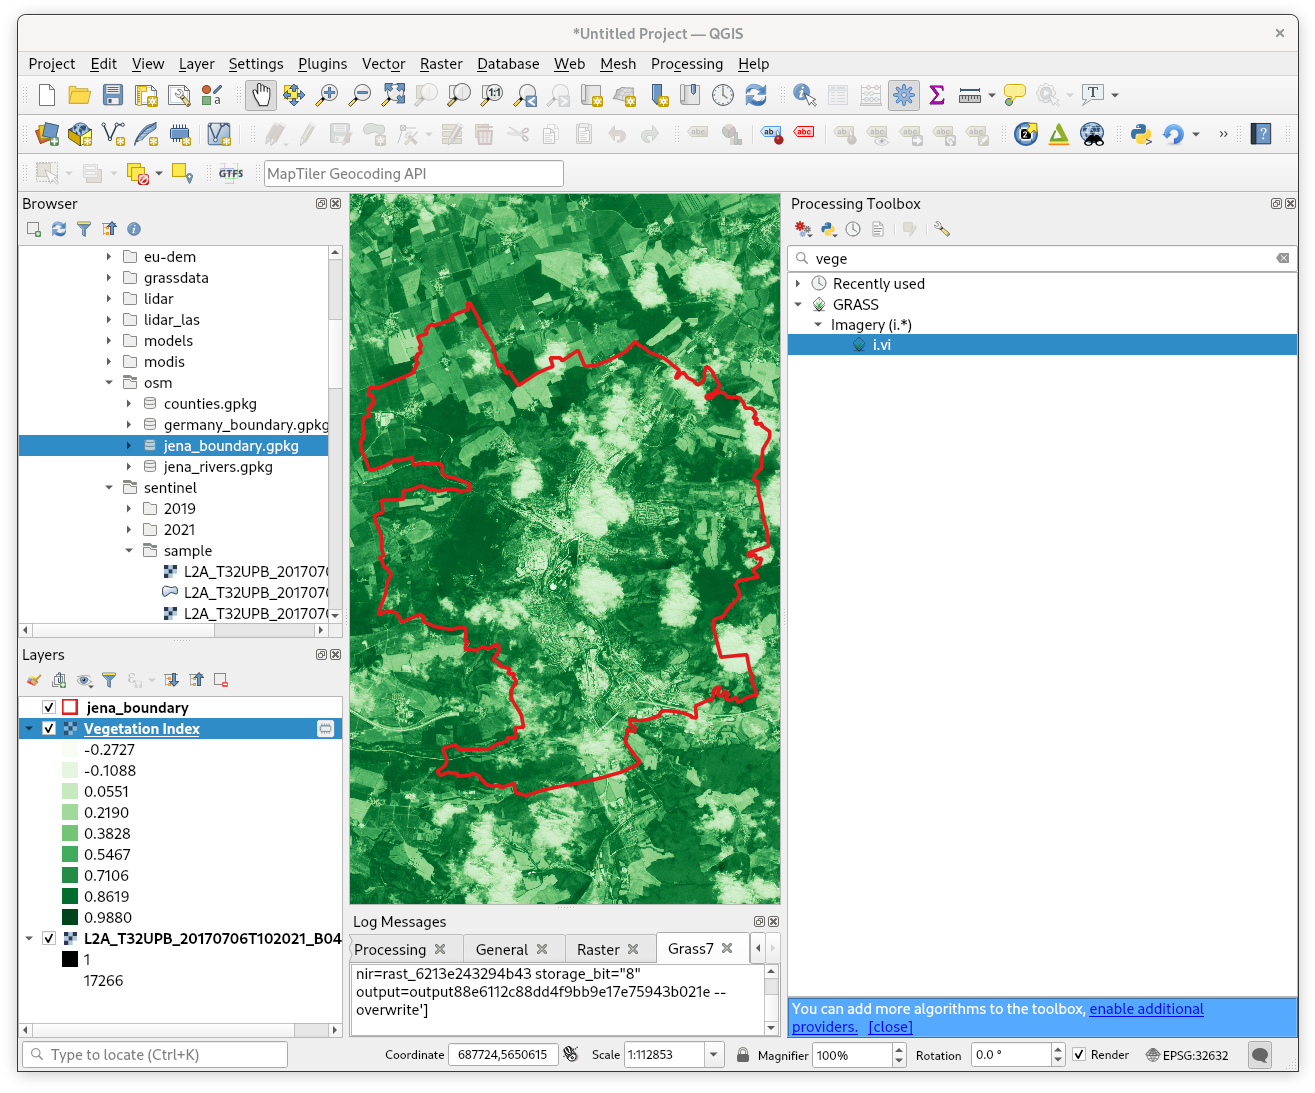
Fig. 48 Computed NDVI raster vizualized in QGIS map window (with better color interpretation than grayscale). No clouds mask involved.