Unit 10 - Python intro
Python programming language is very popular in the field of GIS and data science in general. Python is also the main scripting platform for Esri products (see arcpy package). GRASS is not an exception. In reality, many GRASS tools are basically Python scripts, eg. r.mask (see Source Code section).
GRASS Python environment consists various libraries, see GRASS documentation for details. Let’s focus on three main libraries related to this workshop:
GRASS Script Package as entering node to Python scripting capabilities in GRASS
object-oriented (native for Python) pyGRASS
spatio-temporal GRASS Temporal Framework
Tip
GRASS 8.5 comes with a new GRASS tools package which provides a specialized Python interface to GRASS tools.
PyGRASS is designed as an object-oriented Python API for GRASS. This is a major difference to GRASS Script Package which consists of procedures - Python functions. It is important to highlight that PyGRASS is not a replacement for GRASS Script Package. The both packages are living next to each other. It is up to a user which package will use in his/her scripts. It’s also possible to compine both packages in one single script (not recommended).
Let’s do our first steps towards Python scripting in Python tab.
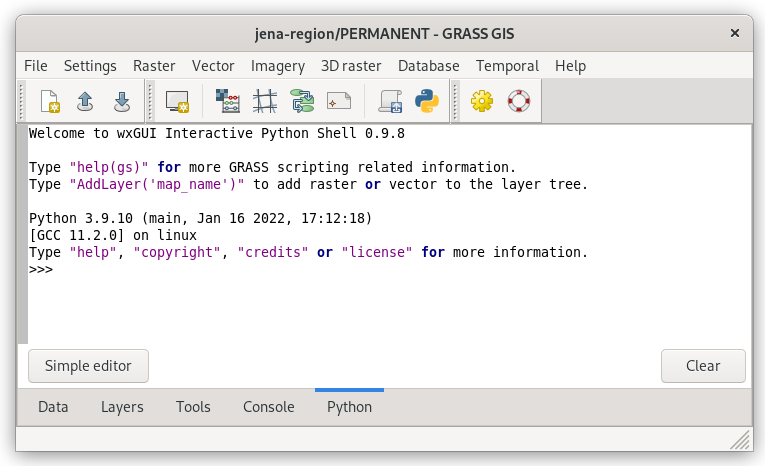
Fig. 65 Interactive prompt in Python tab.
Let’s perform a simple computation workflow below in Python:
Set computation extent based on Jena city region, align computational region to Sentinel bands
Extend computation region by 1km offset
Set mask based on cloud vector map
Compute NDVI
Compute NDVI values statistics, print min, max and mean NDVI values
The workflow is represented by a set of GRASS commands (map names shorten):
# 1.
g.region vector=jena_boundary align=B04_10m
# 2.
g.region n=n+1000 s=s-1000 e=e+1000 w=w-1000
# 3.
r.mask -i vector=MaskFeature
# 4.
i.vi red=B04_10m output=ndvi viname=ndvi nir=B08_10m
# 5.
r.univar map=ndvi
Tip
GRASS tools run from Console or GUI dialogs are logged by commands history. This history may be exported by Export history button in Console tab. Logged commands can be used as a starting point for your first Python script. The commands just need to be changed to satisfy Python syntax. Let’s learn how to do it :-)

Fig. 66 GRASS 8.4 comes with much better command history management.
Python code may be interactively run from Python tab. In the following units PyGRASS API will be systematically used.
GRASS commands can be run in by Module object.
from grass.pygrass.modules import Module

# 1.
Module('g.region', vector='jena_boundary', align='L2A_T32UPB_20170706T102021_B04_10m')
# 2.
Module('g.region', n='n+1000', s='s-1000', e='e+1000', w='w-1000')
# 3.
Module('r.mask', flags='i', vector='MaskFeature', overwrite=True)
# 4.
Module('i.vi', red='L2A_T32UPB_20170706T102021_B04_10m', output='ndvi',
       viname='ndvi', nir='L2A_T32UPB_20170706T102021_B08_10m', overwrite=True)
# 5.
from subprocess import PIPE
m = Module('r.univar', map='ndvi', stdout_=PIPE)
print(m.outputs.stdout)
Tip
Python shell has also its history, previous commands can be browsed by Alt+P, next commands by Alt+N.
To catch output of r.univar tool stdout_=PIPE must be
provided. But it is still not perfect, statistics is printed to
standard output and cannot be processed by Python commands. It would
be feasible to retrieve command’s output as Python object, a
dictionary. This can be done by:
running r.univar with -g to enable shell script (parse-able) output
and using core.parse_key_val function which parses output and store result as a Python dictionary object
# 5.
from grass.script import parse_key_val

m = Module('r.univar', flags='g', map='ndvi', stdout_=PIPE)
stats = parse_key_val(m.outputs.stdout, val_type=float)
print('NDVI min value: {0:.4f}'.format(stats['min']))
print('NDVI max value: {0:.4f}'.format(stats['max']))
print('NDVI mean value: {0:.4f}'.format(stats['mean']))
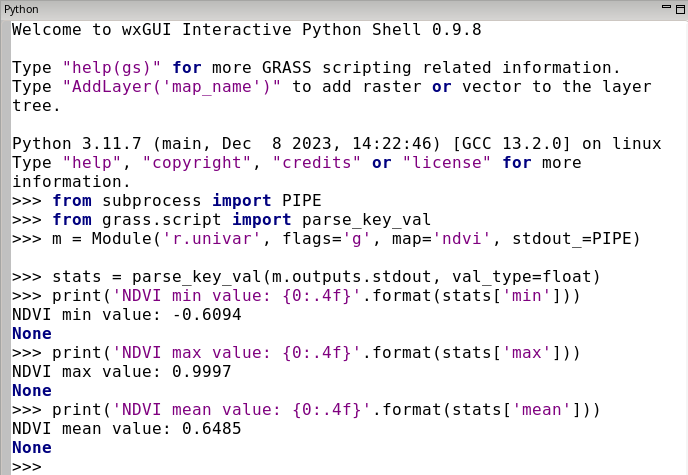
Fig. 67 Running Python code in Python tab.
Resultant NDVI raster map can be displayed easily by calling
AddLayer() function directly from Python shell.
AddLayer('ndvi')
Graphical Modeler and Python
Model created in Graphical Modeler can be easily converted into Python script. Let’s open the model created in Unit 09 - Model tuning: ndvi-v3.gxm and switch to Script editor tab.
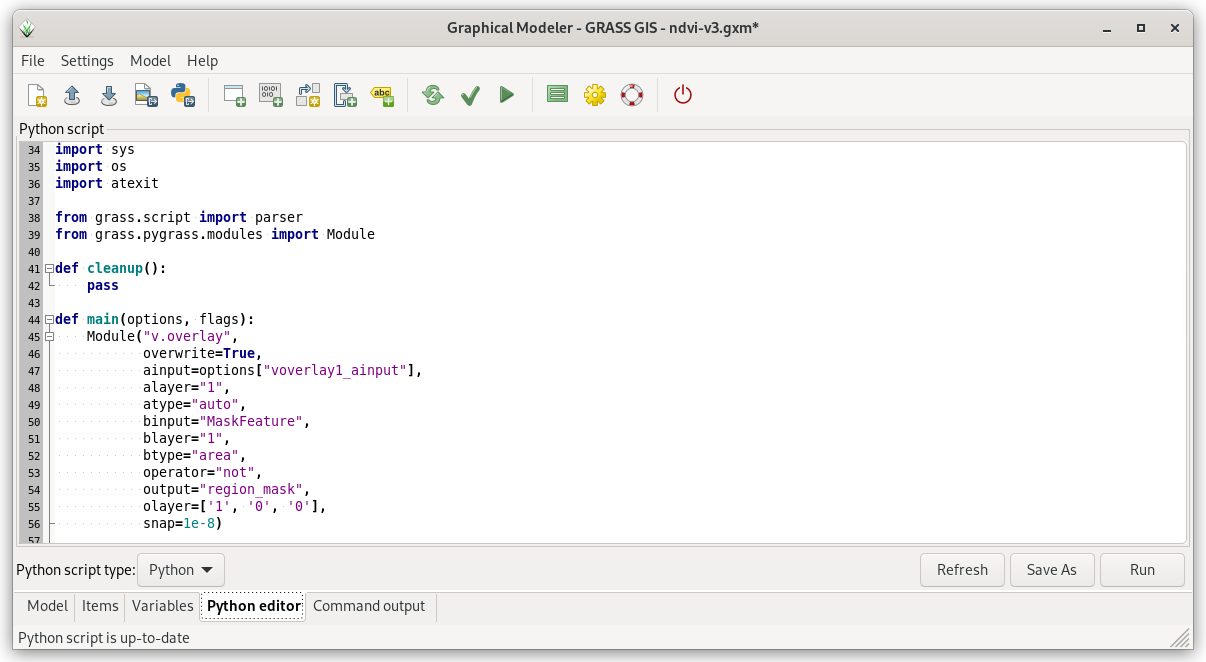
Fig. 68 Python editor integrated in Graphical Modeler. Python code can be
modified, run or saved into file (ndvi-v3.py).
Note
Don’t forget to change Modeler’s settings () to use PyGRASS API (default is GRASS Script package).
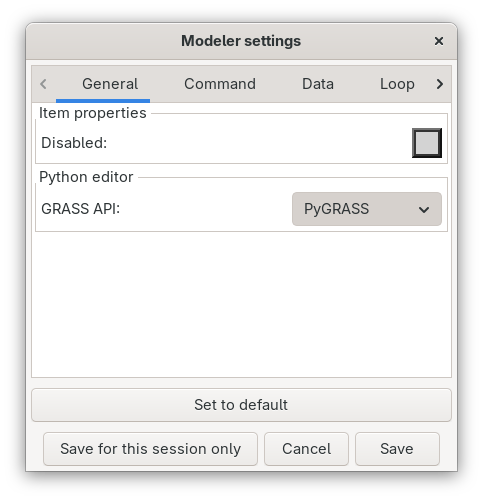
Fig. 69 Change Python API to PyGRASS in the Modeler settings.